WordPress TTFB (Time to First Byte) is the time between your browser asking for a page and the first byte of the answer arriving, and it is the single most important number in WordPress performance because every other metric is built on top of it. It is also the most boring. It does not make a pretty marketing chart, but if your TTFB is bad, everything else (Largest Contentful Paint, Speed Index, Total Blocking Time) is bad too.
Think of TTFB as the foundation of a building. You never admire a foundation, but if it is slow and uneven, every floor above it leans. You can spend weeks decorating the upper floors (optimizing images, deferring scripts), and the building still feels wrong, because the problem was underneath the whole time. A fast TTFB is the flat, solid ground the rest of your performance work stands on.
This is the field guide we hand to teams whose audit flags TTFB as the main bottleneck. It covers what the number actually measures, what good looks like in 2026, and the four-step diagnostic walk we use to take a site from a 1.2-second TTFB to under 200 milliseconds, without changing hosts.
What WordPress TTFB actually measures
TTFB is the gap between the request leaving the browser and the first byte of the response returning. That window holds several things:
DNS resolution (looking up your domain's address, typically 10-80ms).
The TCP handshake (about one network round-trip).
The TLS handshake (the secure connection setup, one to two round trips).
The request is traveling to your origin server.
The origin is doing its work: PHP execution, database queries, plugin hooks, and any external API calls the theme or plugins make synchronously (a hook is a point where WordPress lets plugins run code; synchronous means the page waits for it to finish).
The first byte is traveling back.
For an uncached WordPress page, the biggest slice is almost always the server-side work. The network parts add up to maybe a hundred milliseconds on a healthy connection. The PHP and database parts can run for several seconds if a single hook misbehaves.
What good WordPress TTFB looks like in 2026
Google's Core Web Vitals do not set a TTFB threshold directly, but TTFB is part of the LCP (Largest Contentful Paint) budget. To consistently hit a good LCP (under 2.5s on mobile), you generally want TTFB under about 600ms on the median request. The bands we use in audits:
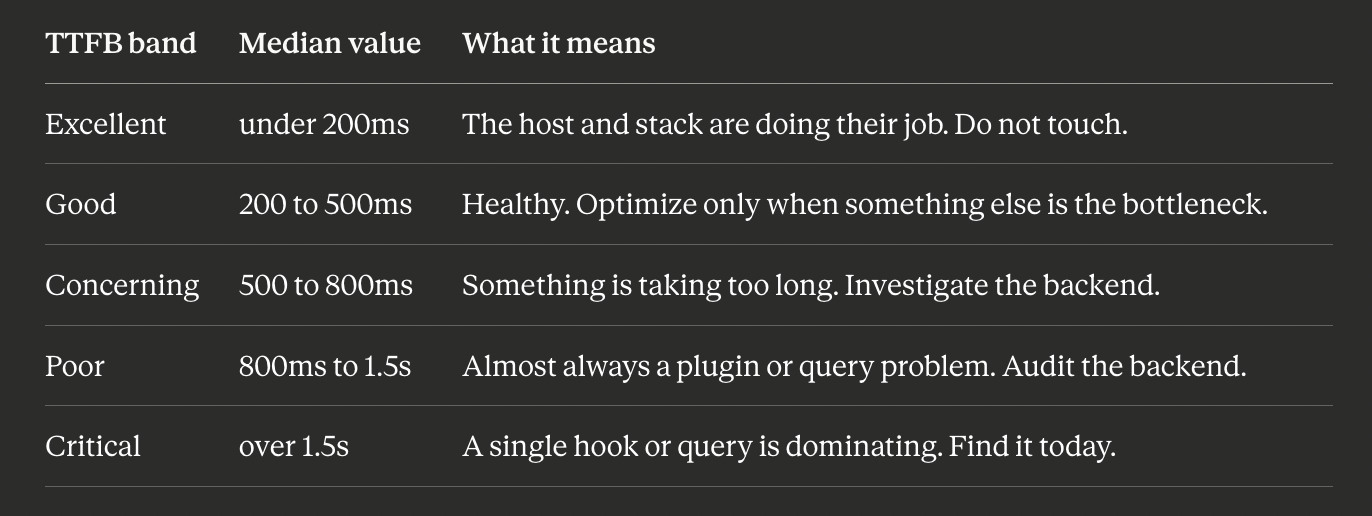
These numbers are for uncached page loads: what a fresh visitor sees, what Googlebot sees on a cold crawl, and what your slow query log records. Cached loads will be 30 to 80ms no matter how broken the underlying code is, which is why "my site is fast" can be true for return visitors and badly false for the first-time visitors who actually decide your conversion rate.
The four-step diagnostic walk
This is the path we walk when TTFB is the verdict. The order matters: each step rules out a class of causes before the next.
Step 1: Confirm it really is TTFB
Open Chrome DevTools, go to the Network tab, and hard-reload your homepage with caching disabled. Click the document request, open "Timing", and read Waiting for server response. That is your TTFB. If it is small (under 300ms) and the page still feels slow, your bottleneck is not TTFB; go look at LCP image loading or render-blocking resources instead. (TTFB is one of [the four layers of WordPress performance] working together; link this to your four-layers post.)
If the number is large, repeat the test with a server-side curl to remove your own connection from the picture:
curl -o /dev/null -s -w 'dns:%{time_namelookup} connect:%{time_connect} ssl:%{time_appconnect} ttfb:%{time_starttransfer} total:%{time_total}\n' https://yoursite.com/If curl's ttfb is close to your DevTools number, the slowness is on the server. If curl is fast but DevTools is slow, the slowness is on the network between you and the origin (CDN edge or ISP path), which requires a different fix.
Step 2: Compare cached vs uncached
Run the same curl twice in a row. The second should be much faster. If both are slow, page caching is broken or disabled. If only the first is slow, caching is working, and your real problem is uncached visitors and bots, so the question becomes how slow the page is when the cache is cold.
To force an uncached path, add a random query string:
curl -s -o /dev/null -w '%{time_starttransfer}\n' "https://yoursite.com/?cache_bust=$(date +%s)"That bypasses both page cache and CDN cache and gives you the honest origin TTFB.
Step 3: Find the heavy hook
If uncached TTFB is over 800ms, a plugin or theme is doing too much synchronous work. Temporarily install Query Monitor and load any uncached page. Its "Hooks & Actions" panel groups time by hook. Common offenders:
initrunning 400 to 800ms because a plugin calls an external API on every page load (license checks, analytics, A/B testing).wpandwp_loadeddoing redirect lookups against thousands of stalewp_postmetarows.A theme's
after_setup_themeregistering hundreds of widgets or sidebars synchronously.
Once you know which hook is heavy, find the plugin that owns the slowest callback in it (Query Monitor shows this). Then deactivate, audit, replace, or move the work to a background job such as Action Scheduler.
Step 4: Find the heavy query
If uncached TTFB is 500 to 800ms and no single hook stands out, the cause is usually one or two queries, each running 100 to 200ms. Query Monitor shows the slowest queries. Look for:
The autoload options query is taking over 50ms, which means your [autoload bloat] is too large (link this to your autoload post).
A
wp_postmetaquery with hundreds of IN values, a sign of N+1 lookups (the same query repeated per item instead of batched once) needing a refactor or index.Any
wp_optionsquery matching_transient%, which means orphaned transients are filling the table (a transient is WordPress's store for temporary data with an expiry).
These are usually fixable in an afternoon, and the TTFB improvement is commonly 200 to 600ms.
Before you change anything: back up first
Steps 1 and 2 only read and measure, so they are completely safe. Steps 3 and 4 involve changes (deactivating plugins, adding indexes, deleting rows), and on a live site, especially a WooCommerce store where a bad change can interrupt checkout, they need care. The rule is simple: back up your database and files, and test in staging before making any change you cannot instantly undo. A backup turns a risky change into a reversible one.
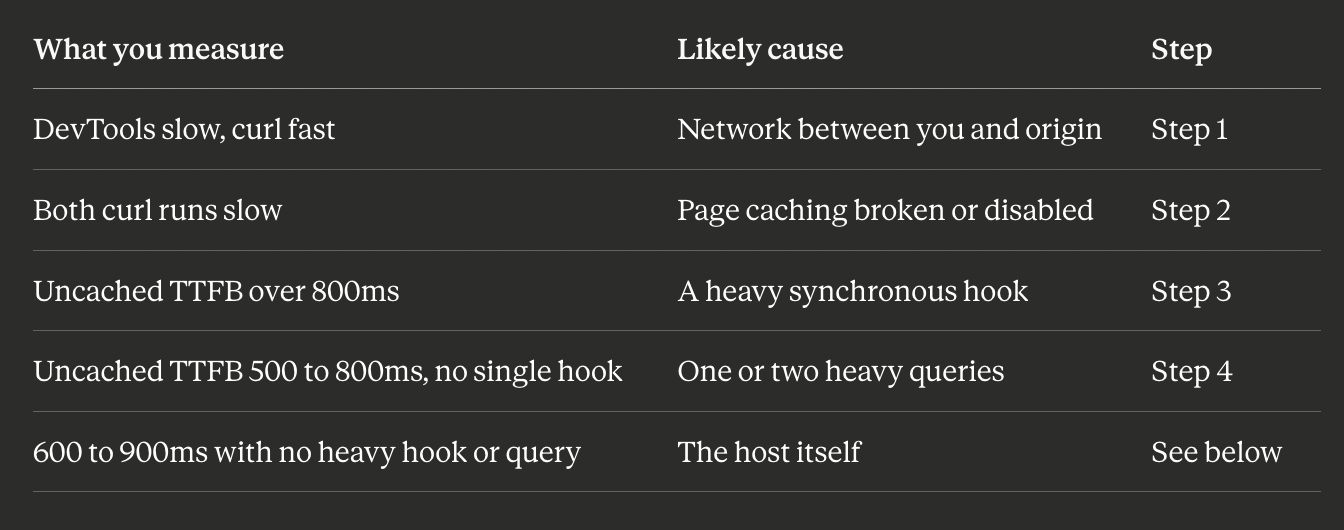
Symptom to cause: where to look
When the host actually is the problem
About one audit in seven really does trace back to the host, but it is the seventh case, not the first. Signs of a host-side TTFB problem:
Uncached TTFB is consistently 600 to 900ms with no heavy hooks or queries.
Adding more PHP workers does not help.
The host's status page shows recent incidents.
Other sites on the same shared plan are also slow.
If those hold, moving to a host with PHP-FPM tuned for WordPress and an SSD-backed object cache yields a 200-400ms TTFB win. But do the four steps first. Switching hosts because of a runaway plugin just moves the problem instead of fixing it.
How BoltAudit finds your TTFB bottleneck
Walking all four steps by hand, with the right tools, takes time. You can have it done automatically.
BoltAudit is a free, AI-powered WordPress performance audit plugin that runs more than 200 read-only checks across frontend, backend, database, and infrastructure in under 90 seconds. When TTFB is your bottleneck, it runs this exact walk and names the specific cause: the hook adding 480ms, the query running long, or the host signal, ranked by impact. Instead of "your TTFB is slow," you get the one thing to fix first. Read-only means it never writes to your database, toggles plugins, or edits files, so it is safe to run on a live production or WooCommerce site. Audits are located under Tools> BoltAudit in your WordPress admin.
Run it on your site
If your return visitors say the site is fast but your analytics show a high bounce rate, your uncached TTFB is probably the gap. Install BoltAudit free, run a Local Audit from Tools, then BoltAudit, and let it name the hook, query, or host signal driving your TTFB, with the fix for each.
Run BoltAudit on your site
Free plugin · 1 site · 3 audits per month · no credit card.