Your WordPress site is slow. You've run Lighthouse, the score is 38, and the report says "Reduce unused JavaScript" — which doesn't tell you which plugin to fix. This is the moment most site owners install three more tools, end up more confused, and ship nothing.
Lighthouse and PageSpeed Insights tell you what's slow (the symptom: LCP, INP, CLS, TTFB). Query Monitor tells you what happened for a single request (per-page details: queries, hooks, PHP errors). BoltAudit tells you which plugin, query, or option to fix first, ranked by expected speed-up. They're not competitors — they answer different questions. Most sites need at least two: a synthetic measurement tool plus a per-plugin attribution tool.
TL;DR
Lighthouse / PageSpeed Insights — best for measuring symptoms and Core Web Vitals. Tells you the site is slow, not which plugin caused it. Free, runs in the browser or via Google's API.
Query Monitor — best for debugging a single page request in depth. Shows queries, hooks, HTTP calls, and per-plugin timings live in the admin bar. Free, only measures what you're currently viewing.
BoltAudit — best for full-site plugin and database attribution, ranked by expected speed-up. Runs 200+ checks across frontend, backend, database, and infrastructure in one pass. Free for your own site, read-only, runs in under 90 seconds.
The pairing most teams need: Lighthouse for the symptom, BoltAudit for the cause. Query Monitor when you need to debug a specific page.
No single tool replaces the other two — they measure different things.
How the three tools differ at a glance
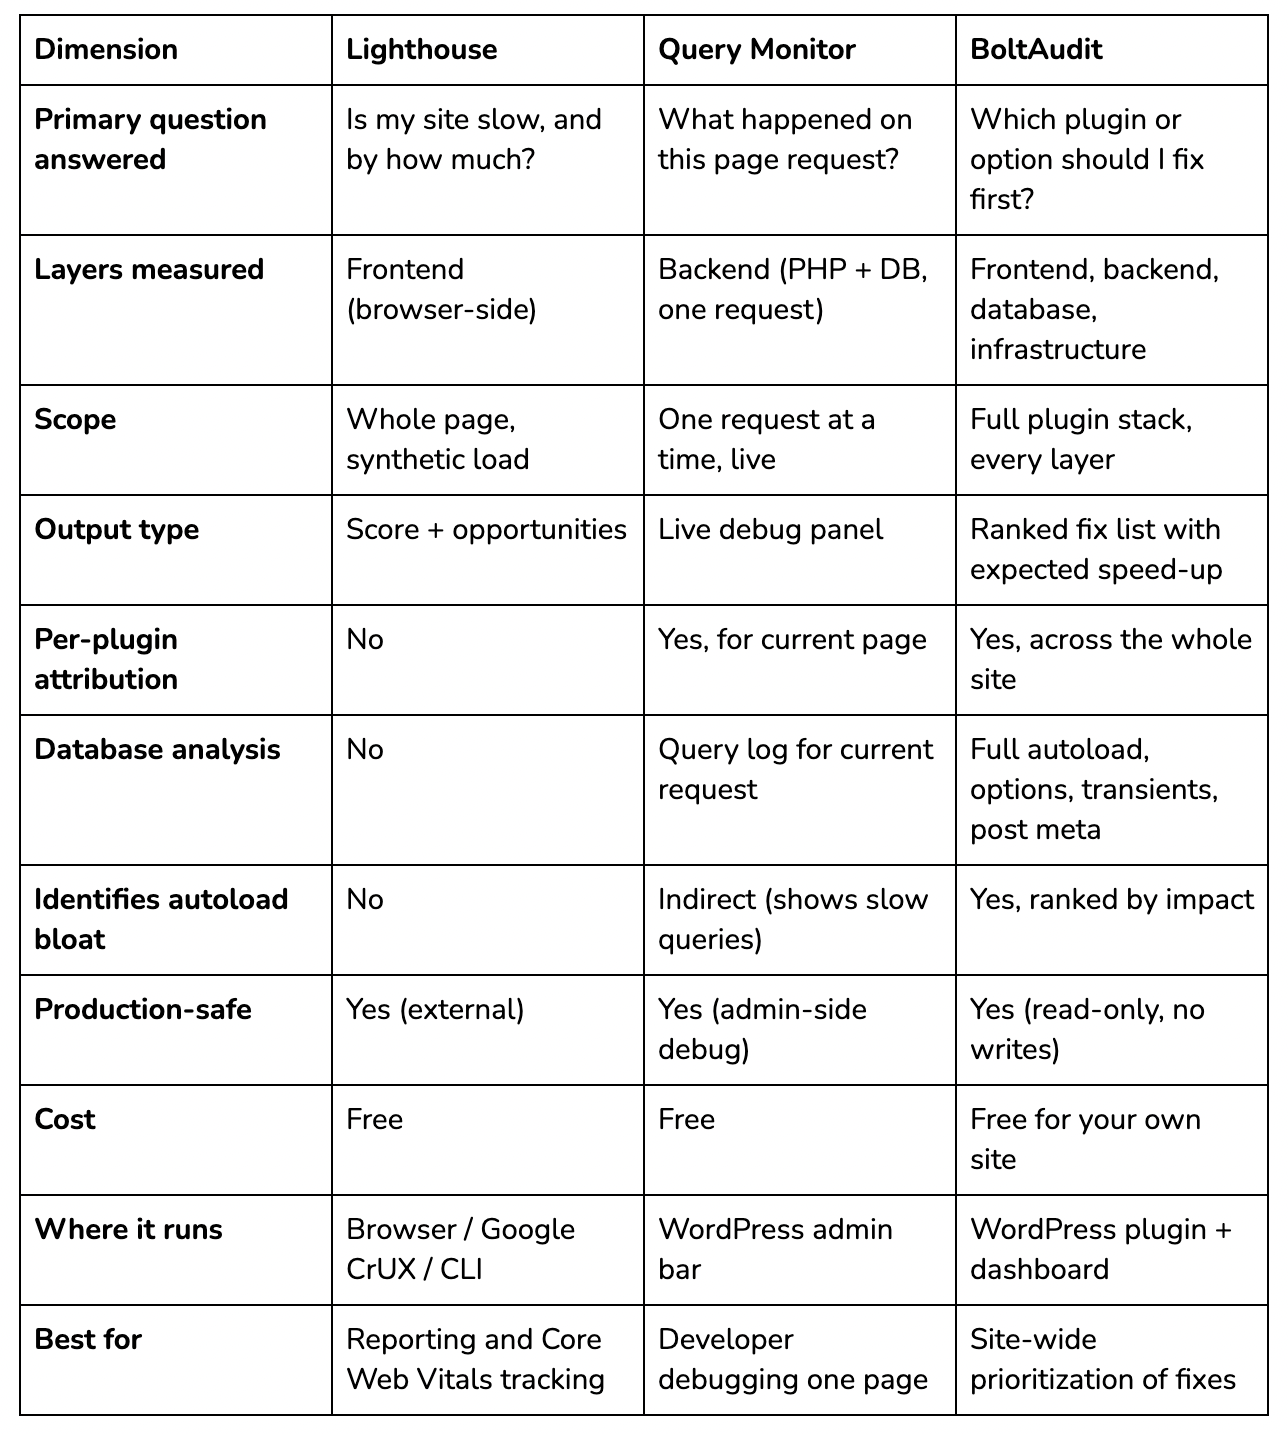
The pattern: each tool is best in class at one job and bad at the other two. Confusion arises when people try to use a single tool for all three.
What Lighthouse actually measures (and what it misses)
Lighthouse is a synthetic page audit that runs in Chrome DevTools, in PageSpeed Insights, or via the CLI. It loads your page in a headless browser with a simulated mobile network and CPU, then scores the browser-side experience.
What it measures well:
Core Web Vitals (LCP, INP, CLS) — these are Google's ranking signals, and Lighthouse is the canonical way to check them
Frontend asset weight — total JS, CSS, image bytes
Render-blocking resources — scripts and stylesheets that delay first paint
Image optimization — modern formats, sizing, lazy loading
Accessibility and SEO checks — useful side benefit
What it doesn't measure:
Server-side time beyond TTFB as a single number — Lighthouse sees TTFB as one figure, not "47ms of PHP boot + 380ms of plugin X execution + 220ms of database queries."
Per-plugin attribution — when Lighthouse says "Reduce unused JavaScript," it's reporting bytes, not "Elementor is loading 240 KB on a page where Elementor isn't used."
Database health — autoload bloat, query counts, table size are all invisible to Lighthouse
Real user data — Lighthouse is synthetic. A 95 score doesn't guarantee real users have a fast experience (use Chrome User Experience Report for that)
When Lighthouse is the right tool: tracking Core Web Vitals over time, validating that a fix actually improved a score, reporting site speed to a stakeholder, generating before/after evidence for a client.
When it's the wrong tool: trying to figure out which plugin is responsible for a slow TTFB. Lighthouse will tell you TTFB is 2.1 seconds. It will not tell you the WooCommerce admin notices option is autoloading 2.4 MB on every request.
What Query Monitor actually measures (and what it misses)
Query Monitor is a free WordPress plugin that adds a debug panel to the admin bar. When you load a page as a logged-in admin, it captures everything that happened during that request: database queries, hooks fired, HTTP API calls, PHP errors, conditional tags, theme template hierarchy, and more.
What it measures well:
Per-page database queries — total count, slowest queries, duplicate queries, broken down by component (plugin/theme)
Per-plugin PHP time for the current request, broken down by hook
HTTP API calls triggered by plugins (Wordfence checking its servers, Yoast pinging Indexnow, etc.)
Conditional tags and template hierarchy — useful for theme debugging
Hook firing order and timings — invaluable when debugging a specific issue
What it doesn't measure:
Anything across multiple pages — Query Monitor only shows the page you're currently viewing as an admin. You can't get a "this is happening across your whole site" view.
Autoload bloat — it shows query timings but not what's in the autoloaded options table by default
Asset weight from the browser's perspective — it tells you what was enqueued, not what the browser actually downloaded and ran
A ranked list of fixes — Query Monitor is a flat data dump. You read it and prioritize manually.
Real user metrics — like Lighthouse, it only reflects what happened on the request you triggered
When Query Monitor is the right tool: debugging why a specific page is slow, finding which plugin is firing a particular hook, investigating a duplicate query problem, doing deep developer-level inspection.
When it's the wrong tool: trying to get a site-wide view of which plugins to fix first. Loading every page on a 200-page site and reading the Query Monitor panel for each is not a workflow.
What BoltAudit actually measures (and what it misses)
BoltAudit is a WordPress plugin and connected dashboard that runs a single deterministic audit across all four layers of the stack: frontend, backend, database, infrastructure. The audit is read-only and completes in under 90 seconds. It's free for your own site.
What it measures well:
Per-plugin runtime impact across the full plugin stack — PHP time, hooks fired, queries triggered, assets enqueued, ranked by expected speed-up if removed or fixed
Autoload and database health — every row in wp_options with autoload=yes, ranked by size; orphaned post meta and term meta; transient bloat; table sizes; custom DB tables
Server environment — PHP version, opcache config, memory limits, MySQL/MariaDB version, hosting tier detection across 50+ known hosts (Kinsta, WP Engine, SiteGround, Cloudways, Hostinger, and others)
Infrastructure detection — CDN in use (Cloudflare, Bunny, Fastly), page builder in use (Elementor, Bricks, Breakdance, Beaver Builder, Divi), and a skill registry that adapts recommendations to that stack
AI Audit root-cause analysis — when connected to the dashboard, it correlates findings across the four layers to identify which fix will move the needle most
What it doesn't measure:
Live user-by-user behavior — BoltAudit measures what your site does on a synthetic audit run, not what happens to user #4,827 on a flaky cellular network at 2 a.m.
Frontend rendering at the browser level — it inspects enqueued assets and HTML output, but for actual paint timing and layout shift on real devices, you still need Lighthouse / CrUX
Code-level bugs and theme debugging — Query Monitor is better for that on a specific page
When BoltAudit is the right tool: figuring out which plugin or database issue to fix first; auditing a site you didn't build (an agency taking over a client); validating that a stack of 30+ plugins is healthy; finding autoload bloat and orphaned metadata; doing a monthly site health check.
When it's the wrong tool: tracking Core Web Vitals scores over time (use PageSpeed Insights), debugging one specific weird hook firing (use Query Monitor), measuring how real users on real devices experience your site (use CrUX or a RUM tool).
How the three answer the same question differently
A WooCommerce store has a 3.2-second TTFB. The owner runs each tool. Here's what each one reports.
Lighthouse / PageSpeed Insights says:
Performance score: 42. LCP: 4.1s. TTFB: 3.2s. Opportunities: "Reduce unused JavaScript (estimated savings 280 KB)." "Eliminate render-blocking resources."
Useful: confirms the site is slow and quantifies it with Core Web Vitals. Not useful: doesn't say which plugin is bloating JS or causing TTFB.
Query Monitor (on the homepage) says:
247 queries total, 1.8s of database time. Top plugins by time: WooCommerce 220ms / 38 queries; Elementor 180ms / 47 queries; Wordfence 150ms / 18 queries. Slowest query: SELECT FROM wp_options WHERE autoload = 'yes'.
Useful: per-plugin attribution for the homepage. Names the slowest query. Not useful: only the homepage was checked. The slow autoload query is reported as slow, but Query Monitor doesn't show what is autoloaded.
BoltAudit says:
Estimated speed-up by fix, ranked:
Delete woocommerce_admin_notices autoloaded option (2.4 MB) — estimated TTFB reduction 1.0–1.5s. One-click fix or single SQL command.
Defer MonsterInsights GA4 tracker — estimated LCP reduction 0.4–0.6s. Snippet provided.
Restrict Elementor CSS loading to Elementor-built pages — estimated 80 KB saved on blog pages.
Move 12 transients to non-autoloaded — estimated 200ms TTFB reduction.
Useful: a ranked action list with expected impact. The first fix alone resolves most of the problem. Not useful: doesn't show you the Lighthouse score itself (you still need PageSpeed Insights for that).
The combined picture is what most sites need. Lighthouse tells you the score is 42. BoltAudit tells you fix #1 will likely take you to 78. Query Monitor confirms it in real time after the change.
Which tool to use, by job
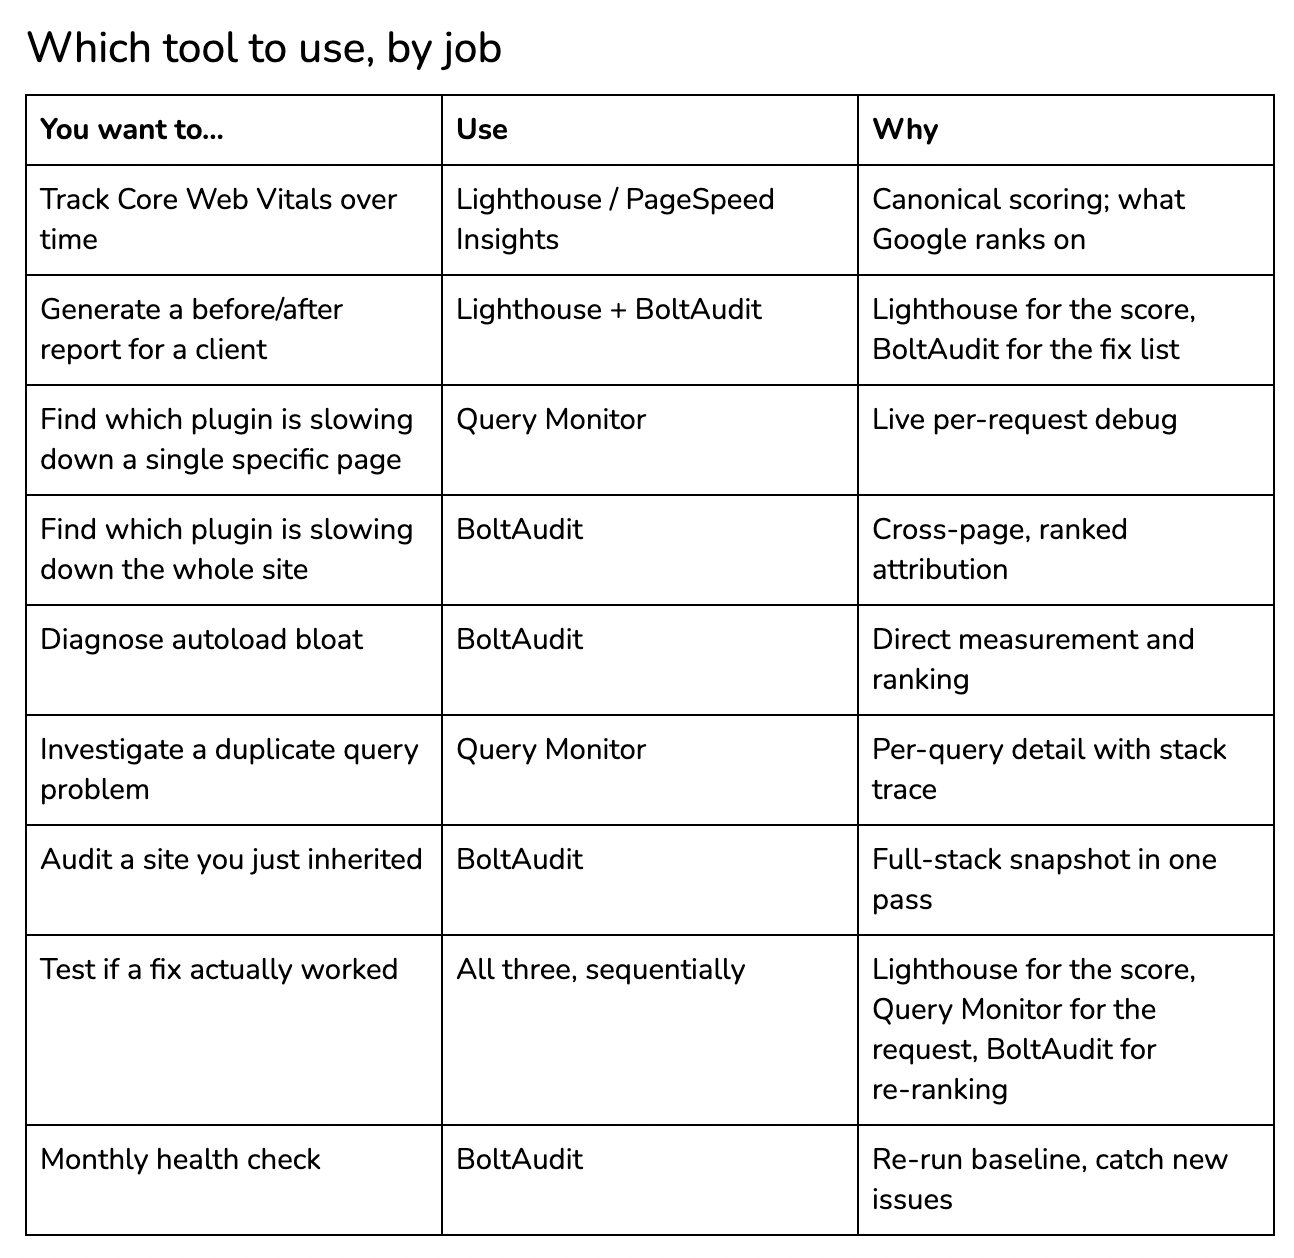
If you only have time for one: PageSpeed Insights for symptom tracking. If you have time for two: PageSpeed Insights plus BoltAudit. Query Monitor joins the kit the first time you need to debug something specific.
Why "just use Lighthouse" isn't enough
A common pattern: a site owner runs Lighthouse, sees a low score, opens the report, scans the "Opportunities" section, and gets stuck. The report says things like "Reduce unused JavaScript" and "Avoid enormous network payloads." These are accurate descriptions of the symptoms. They don't tell you what to do.
What's actually happening in that gap: Lighthouse is measuring the browser. It doesn't know that 280 KB of unused JavaScript came from Elementor's default CSS loading on a blog page that doesn't use Elementor. It doesn't know that the 3.2-second TTFB was caused by a single autoloaded option from a deprecated extension. Those attributions require server-side measurement, but Lighthouse doesn't provide it.
This is the gap BoltAudit was built for. Lighthouse reports the symptom; BoltAudit names the cause and ranks the fix. The two together are how you actually ship the improvement.
Common mistakes when comparing these tools
Treating them as competitors. They measure different things. Picking one means losing the other's view.
Running Lighthouse without acting on it. A score-tracking habit without a fix-shipping habit produces no improvement. The fix list comes from a different tool.
Reading Query Monitor like a report. Query Monitor is a developer debug panel. It assumes you can read a query log and decide what matters. If you're a non-developer site owner, the output will overwhelm you.
Assuming BoltAudit replaces Lighthouse. It doesn't. BoltAudit doesn't measure browser paint timing or Core Web Vitals scores directly. For Core Web Vitals tracking, you still want PageSpeed Insights.
Comparing scores across tools. A Lighthouse score of 80 doesn't map to a "BoltAudit score" or a "Query Monitor score" because they're not measuring the same thing. Each tool has its own unit, and they don't translate.
What to do next
If you're trying to diagnose a slow WordPress site right now:
Get the baseline. Run PageSpeed Insights on your homepage and one product/post page. Note LCP and TTFB.
Get the cause. Install BoltAudit from WordPress.org. The first audit is free, takes under 90 seconds, and gives you a ranked list of fixes.
Ship the top fix. Don't try to fix everything. The highest-impact fix is usually 1–2 changes, and BoltAudit ranks them in order.
Verify. Run PageSpeed Insights again. The Lighthouse score should move. If it doesn't, re-run BoltAudit to confirm the fix was applied as intended.
Add a Query Monitor when you need it. Keep it installed for the moments you need to debug a specific page in depth. It's free and doesn't run for non-admins, so there's no production cost.
The fastest path from "my site is slow" to "my site is faster" is symptom → cause → fix → verify. No single tool gives you all four. The combination does.
Frequently asked questions
Is BoltAudit a replacement for Lighthouse?
No. Lighthouse measures Core Web Vitals and browser-side rendering — what Google uses for ranking. BoltAudit measures server-side, database, and per-plugin impact — what's actually causing the slow scores. Most sites use both: Lighthouse for the score, BoltAudit for the fix list.
Can I use Query Monitor on a production site?
Yes. Query Monitor only runs for logged-in users with admin or developer roles. Visitors and customers don't see it and aren't slowed down. That said, leaving it active on hundreds of admin accounts adds noise to admin-side performance, so most teams enable it only when debugging.
Why doesn't Lighthouse show me which plugin is slow?
Because Lighthouse runs in the browser. It sees what the browser receives — HTML, CSS, JS, images — but not what WordPress did on the server side to produce that output. Per-plugin attribution requires server-side instrumentation, which Query Monitor (per-request) and BoltAudit (site-wide) provide.
Is BoltAudit safe to run on a live WooCommerce store?
Yes. BoltAudit is read-only by design. It never writes to the database, never toggles plugins, and never edits files. Audits run on demand via a single AJAX request and complete in under 90 seconds with no front-end runtime impact. It's built for production stacks, including plugin-heavy and WooCommerce environments.
What about GTmetrix, WebPageTest, and other speed tools?
GTmetrix and WebPageTest are in the same category as Lighthouse — synthetic page audits that measure symptoms. GTmetrix uses Lighthouse under the hood for its modern reports. WebPageTest gives you more granular waterfall and filmstrip data, which is useful for advanced frontend debugging. None of them attribute slowness to specific plugins or database issues.
Do I need a paid performance tool if I have all three of these?
Probably not, for most sites. Lighthouse is free via PageSpeed Insights and Chrome. Query Monitor is free on WordPress.org. BoltAudit is free for your own site. Paid tools (New Relic, Blackfire, Datadog APM) become worth it for sites with significant traffic, where continuous monitoring and historical trending pay for themselves — but the diagnostic question "why is my site slow?" is well answered by the free trio.
Can I run a Lighthouse audit and a BoltAudit audit simultaneously?
Yes, and you should. They don't interfere with each other. Lighthouse runs in a browser against your URL; BoltAudit runs server-side via the WordPress plugin. Running them in the same session gives you the symptom and the cause in parallel.
______________________________________________
About this post: This comparison was written by the BoltAudit team. We've tried to be honest about where each tool wins, because comparison content that pretends one tool does everything is worse than no comparison at all. If you spot a factual error about Lighthouse or Query Monitor (both excellent tools), let us know — we'll correct it.
Run BoltAudit on your site
Free plugin · 1 site · 3 audits per month · no credit card.