If your WordPress dashboard takes 6 seconds to load and your homepage isn't much faster, the cause is almost always one or two specific plugins, not all of them. The problem is finding which ones without disabling everything and breaking your site for an hour.
The fastest way to identify the slow plugin on a WordPress site is to measure each plugin's actual runtime impact (PHP execution time, autoloaded options, database queries, and enqueued assets) during a live request, rather than disabling plugins one by one. Tools like Query Monitor show this for one request at a time; BoltAudit runs all four measurements across your full plugin stack in under 90 seconds and ranks plugins by expected speed-up if removed.
TL;DR
Disabling plugins one by one works, but it's slow and risky on a live site. A 30-plugin site can take an afternoon and break user sessions while you toggle.
The four measurements that actually matter are PHP execution time per plugin, autoloaded options size contributed, database queries triggered, and frontend assets enqueued. Any one of those can be the culprit; usually, it's two or three combined.
For a single page, Query Monitor is excellent and free. It shows per-plugin query counts and timings in the admin bar.
For a full-site diagnosis ranked by impact, an audit tool like BoltAudit measures all four layers across every plugin in one read-only pass.
The most common offenders are well-known: page builders rendering on every request, security plugins running on every page load, analytics plugins blocking the main thread, and WooCommerce extensions autoloading large option rows.
Why "disable plugins one by one" is bad advice
The advice you'll find on most WordPress forums goes like this: deactivate all your plugins, then reactivate them one at a time, testing site speed after each. It works, technically. It also has three problems.
It breaks your live site. Deactivating plugins on a production site logs users out, breaks WooCommerce checkout sessions, kills active forms, and can trigger 500 errors if plugins depend on each other. For a personal blog, this is fine. For a store doing $5K/day in revenue, an hour of broken checkout is real money.
It only finds catastrophic offenders. If three plugins each add 0.4 seconds, no single deactivation makes a dramatic difference. You'd need to test combinations, which means 2^N tests for N plugins. Thirty plugins mean a billion combinations.
It tells you which plugin, not why. Knowing "Plugin X is slow" doesn't tell you whether to replace it, configure it differently, or fix a specific setting. The root cause matters because most slow plugins have a fix that doesn't require removing them.
The better approach is to measure each plugin's actual contribution directly, on a live request, without disabling anything.
The four measurements that actually identify a slow plugin
A plugin can slow down WordPress in four distinct ways. A real diagnosis checks all four because they're independent. A plugin can be fast on its own, but bloat your database. A plugin can have a tiny database footprint but block the main thread with a 200KB JavaScript file.
1. PHP execution time per plugin
This is what most people mean by "slow plugin." It measures how many milliseconds each plugin's PHP code runs during a page request. A well-built plugin runs in under 5ms on a typical page. A poorly-built one can run for 200ms or more.
How to measure it: Query Monitor (free, on WordPress.org) shows this per plugin in its admin bar, broken down by hook. It only measures the page you're currently viewing, so check both the frontend page and the admin dashboard.
What "bad" looks like: a single plugin contributing more than 100ms to a page where the total render time is 800ms. That plugin is responsible for 12% of your load time.
2. Autoloaded options size
Every WordPress page request reads all autoloaded options from the wp_options table into memory before doing anything else. The total should stay under 1 MB. Many plugins write hundreds of KB of data to autoloaded options without realizing it; one notorious example is woocommerce_admin_notices, which we've seen reach 2.4 MB in production stores.
How to measure it: run this SQL query in phpMyAdmin or via WP-CLI to see your top autoload offenders
What "bad" looks like: any single autoloaded option over 100 KB. Total autoload over 1 MB. A WooCommerce store with 5 MB of autoload (this is common and silently destroys TTFB).
3. Database queries triggered
A page that runs 200 queries will be slower than one that runs 20, even if each query is fast. Plugins that aren't built carefully can trigger hundreds of redundant queries through nested loops or unbatched get_post_meta calls.
How to measure it: Query Monitor shows the total number of queries per page and breaks them down by plugin. Look for plugins responsible for more than 30 queries on a single page load.
What "bad" looks like: 200+ queries on a homepage. A single plugin generating 50+ queries. Repeated identical queries (a sign of missing caching inside the plugin).
4. Frontend assets enqueued
Plugins that load JavaScript and CSS on every page, even pages where they aren't used, slow down the browser-side render. A contact form plugin that loads its scripts on your blog posts is the classic example.
How to measure it: open Chrome DevTools, go to the Network tab, filter by JS and CSS, and look for files served from /wp-content/plugins/. Then check each file's size and whether it was actually needed on that page.
What "bad" looks like: a single plugin loading more than 100 KB of JS on pages where the plugin isn't visually used. Render-blocking scripts in <head> from plugins that could load deferred.
How to measure all four at once
Checking the four measurements manually for every plugin on a 30-plugin site takes hours. This is where audit tools earn their keep.
BoltAudit runs all four measurements in a single read-only pass and ranks every plugin by its total contribution to slow load times. It reads the autoload table, profiles PHP execution against the WordPress hook system, captures the live query log via $wpdb, and inspects enqueued assets. The audit completes in under 90 seconds and never writes to the database.
The output you actually want from any audit tool, BoltAudit or otherwise, is a ranked list that looks something like this:
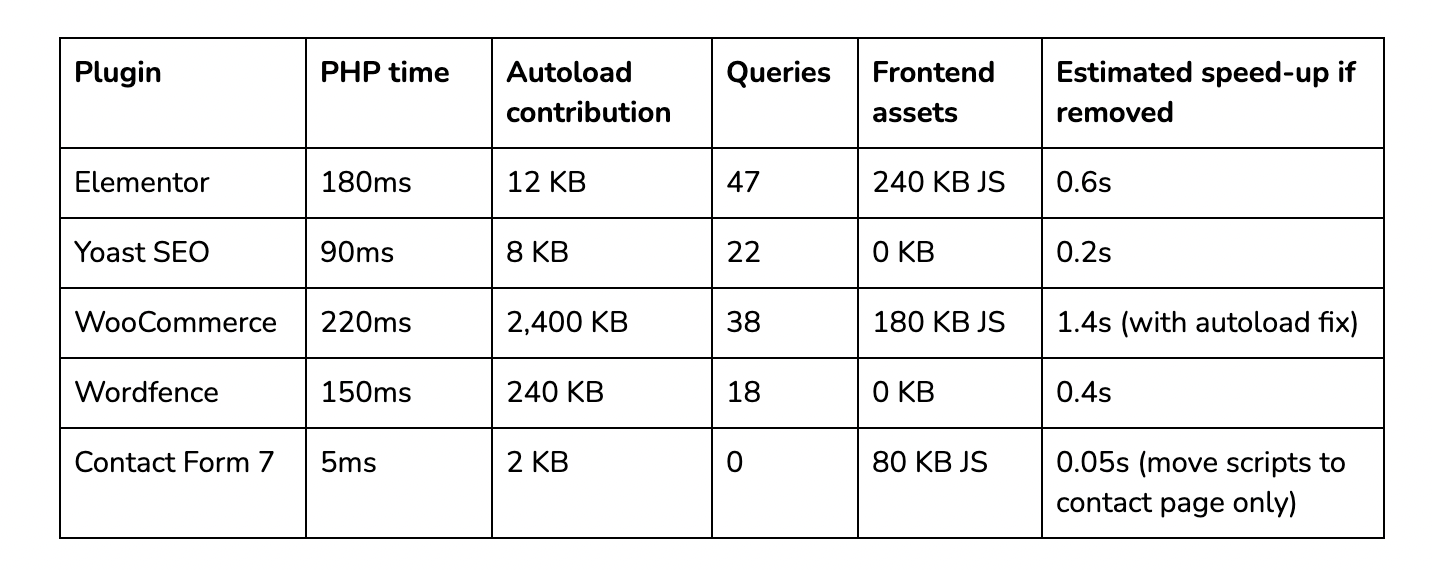
The ranking matters more than the raw numbers. A plugin with a 1.4-second estimated speed-up is where you start, not the plugin with the highest PHP time alone.
The five plugin categories most likely to be the culprit
Across thousands of WordPress sites, the slow plugin is almost always one of these five types. If you don't have time to run an audit, start by checking these.
Page builders are rendering on every request
Elementor, Divi, WPBakery, and Bricks all add real PHP overhead because they parse a complex data structure on every page load. The fix is rarely to remove the page builder — it's to enable its built-in caching, defer its JS, and stop loading its CSS on pages built with the default editor.
Security plugins running on every page
Wordfence, iThemes Security, and All In One Security each add 80–200ms per request because they inspect every request for suspicious patterns. This is often worth the cost — but if you're already on a managed host (Kinsta, WP Engine, Cloudways) that handles server-level security, the plugin is duplicating work.
Analytics and tag manager plugins
MonsterInsights, GA4 plugins, and Google Tag Manager integrations are common LCP killers because they inject third-party scripts that block the main thread before content renders. The fix is to defer the trackers rather than remove them, and to use server-side tracking where possible.
WooCommerce extensions and admin notices
WooCommerce itself is fast for what it does, but its extensions often write large rows to autoloaded options. The woocommerce_admin_notices option alone can reach 2 MB on stores with several extensions installed. We covered this in detail in our WooCommerce queries audit.
Backup and migration plugins running scheduled tasks
UpdraftPlus and similar plugins are usually fine, but their scheduled tasks can spike server load during a backup window. If your site is slow at the same time every night, check what's scheduled in WP-Cron.
A worked example: a real WooCommerce store
A WooCommerce store running Elementor, WooCommerce 8, Yoast, MonsterInsights, and 22 other plugins came to us with a 3.8s TTFB on the homepage. The shared hypothesis was "we have too many plugins."
The audit found three offenders, not 27:
woocommerce_admin_notices autoloading 2.4 MB on every request. Read on every page, only used in the admin dashboard. Fix: delete the option (it regenerates clean). Result: TTFB dropped from 3.8s to 1.9s in 10 seconds.
MonsterInsights is loading the GA4 tracker in the document head, render-blocking. Fix: defer the script. Result: LCP dropped from 3.1s to 2.0s.
Elementor's default CSS is loading on the blog (which uses the block editor, not Elementor). Fix: configure Elementor to load only on pages built with it. Result: 80 KB CSS removed from blog pages, modest LCP improvement.
Three fixes, none of them "remove a plugin," and the site went from a 38 Lighthouse score to 84.
The lesson: the question isn't "which plugin should I remove?" It's "which plugin is doing the most expensive thing it doesn't need to be doing." Audits find that. Trial-and-error toggling rarely does.
When to use which tool
Different tools answer different questions. Pick the question you're actually asking.
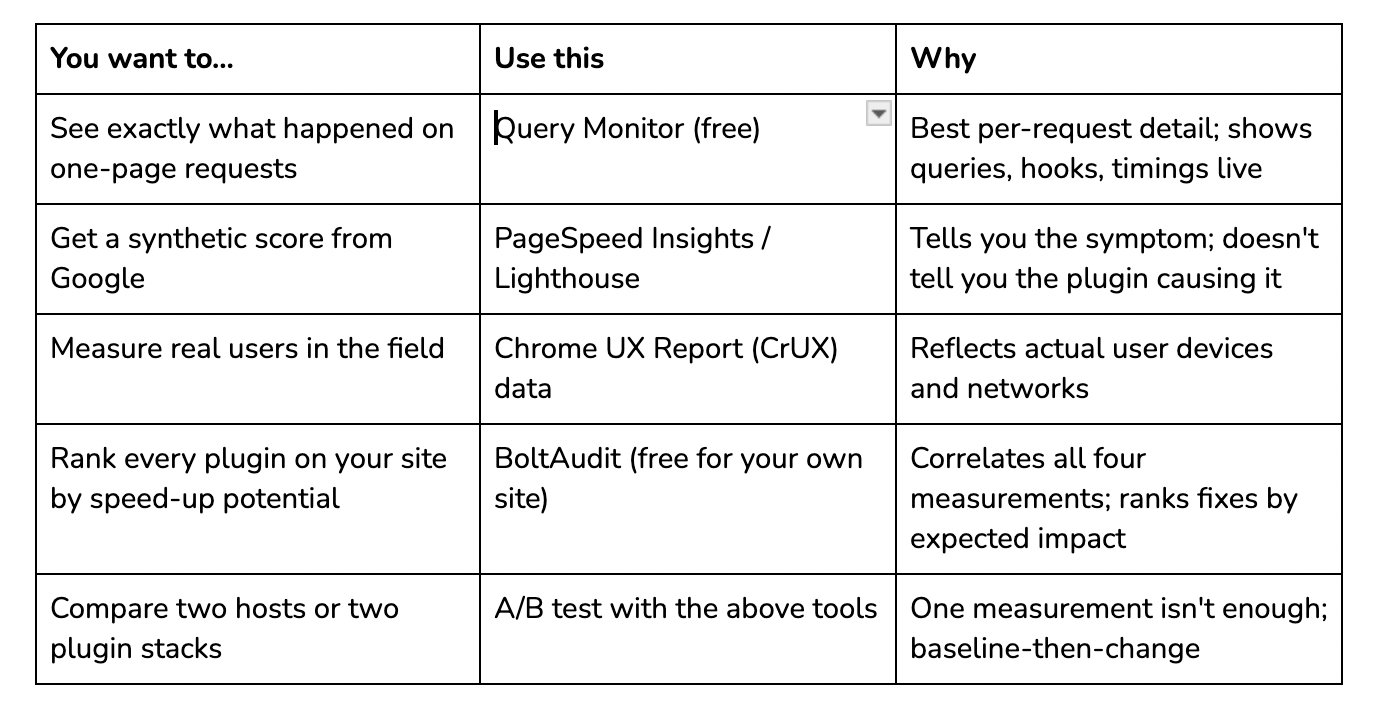
Most sites benefit from using two of these together: a synthetic tool (Lighthouse or PageSpeed Insights) to identify the symptom, and a per-plugin tool (Query Monitor for spot checks, BoltAudit for full-site checks) to identify the cause.
What to do next on your site
If you're trying to find the slow plugin on your WordPress site right now, the order is:
Run PageSpeed Insights on your homepage and one product/post page. Note the TTFB and LCP. This is your baseline.
Install Query Monitor. Open the homepage as an admin user, click the Query Monitor admin bar item, and check the "Queries by Component" panel. Note the top three plugins by query time.
Run a full audit. Either work through each of those plugins manually, or run BoltAudit for a ranked list of every plugin's contribution. The free WordPress.org plugin is read-only and runs in under 90 seconds.
Fix the highest-impact issue first. Usually, this is an auto-load bloat or a render-blocking script, not a plugin that needs to be removed.
Re-measure. Run PageSpeed Insights again and confirm the change moved the needle.
The most common mistake at this stage is fixing the second or third issue first because it's easier. Always start with the highest expected speed-up — even if the fix is harder, you'll feel it.
Frequently asked questions
How do I find a slow WordPress plugin without deactivating anything?
Use a measurement tool that profiles plugins on live requests. Query Monitor (free) shows per-plugin timings for one page at a time via the admin bar. BoltAudit runs read-only across your full plugin stack and ranks every plugin by impact in under 90 seconds. Neither tool deactivates anything.
Can a plugin slow down my WordPress site even if I'm not using it?
Yes. An installed but deactivated plugin doesn't run, but an activated plugin you've stopped using actively can still load scripts on every page, write to autoloaded options, and run scheduled tasks. Deactivate plugins you no longer use; uninstall the ones you're sure you don't need.
Why is my WordPress site slow if Lighthouse says my plugins are fine?
Lighthouse measures the browser-side render. It doesn't see PHP execution time, database query counts, or autoload bloat — all of which slow down TTFB before Lighthouse starts measuring. A site with a 3-second TTFB will get a poor Lighthouse score even if every plugin is "fine" from the browser's perspective.
How many plugins are too many for WordPress?
There's no fixed number. A site running 50 well-built lightweight plugins can be faster than a site running 5 heavy ones. The real metric is total runtime impact — the combined PHP time, autoload bytes, queries, and assets across all plugins. Measure that, not the plugin count.
Should I remove plugins or just configure them better?
Configure first. Most slow plugins have fixes that don't require removal: turn off unused features, defer scripts to load only when needed, and exclude pages from monitoring. Removal is the right answer when a plugin overlaps with another you already have, or when its functionality is being handled at the server level by your host.
How often should I audit my WordPress plugins for performance?
After every plugin update, after adding any new plugin, and on a routine monthly schedule for live sites. Plugin performance changes over time as features get added; a plugin that was fast last year may have shipped a new version with a large autoload contribution this month.
_______________________________________________________________
About this post: This is part of BoltAudit's WordPress performance series. BoltAudit is a read-only audit tool that runs 200+ checks across frontend, backend, database, and infrastructure layers, then ranks fixes by expected speed-up. Run a free audit on your site or install the WordPress.org plugin.
Run BoltAudit on your site
Free plugin · 1 site · 3 audits per month · no credit card.